
Polyester staple fiber (PSF) demand is poised for steady expansion between 2025 and 2030, underpinned by strong downstream recovery and accelerated sustainability adoption. Global volume is expected to rise at a mid-single-digit CAGR, with recycled PSF (rPSF) share reaching nearly 50% by 2030. Major forces include tightening recycled content mandates, technology upgrades in spinning, and broader retail sustainability goals.
Methodology & Scope
The study covers 2024–2030 global PSF demand, split by virgin PSF and recycled PSF (rPSF), across eight major regions. Both top-down macro indicators (GDP, textile exports, construction growth) and bottom-up end-use modeling (apparel, nonwovens, automotive, filtration) inform the projections.
Definitions:
- Virgin PSF: PTA/MEG-derived staple fiber.
- rPSF: mechanically or chemically recycled PET converted to staple fiber.
- Grades: solid vs. hollow, conjugate, siliconized (HCS), and dope-dyed.
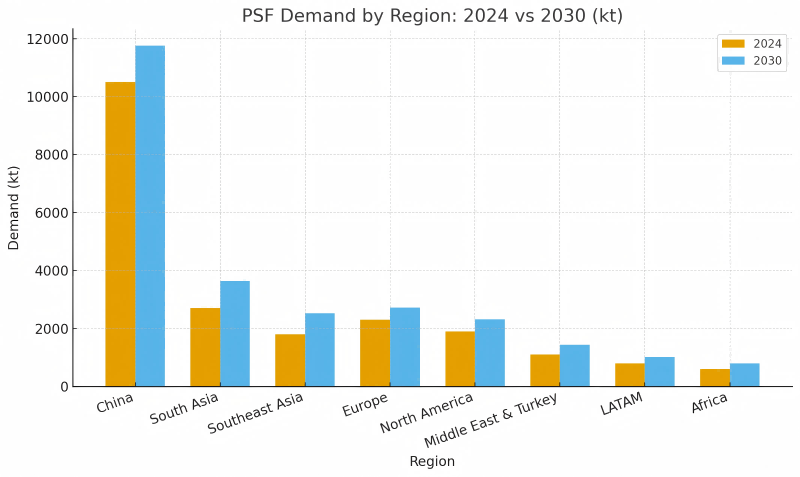
Market Size & Outlook (2024 → 2030)
Demand remains dominated by China, though South and Southeast Asia show the fastest growth, driven by apparel and nonwovens investment. Europe and North America’s focus shifts toward traceable, high-quality rPSF.
Capacity Additions by Region and Year (kt)
| Year | China | South Asia | Southeast Asia | Europe | Middle East & Turkey | North America |
| 2025 | 116 | 81 | 124 | 145 | 122 | 94 |
| 2026 | 78 | 187 | 61 | 106 | 70 | 81 |
| 2027 | 108 | 189 | 90 | 114 | 133 | 190 |
| 2028 | 122 | 187 | 97 | 58 | 142 | 172 |
| 2029 | 136 | 73 | 121 | 104 | 157 | 112 |
| 2030 | 143 | 130 | 158 | 136 | 97 | 83 |
Macro & Cost Drivers
Feedstock and energy costs dominate PSF pricing. PTA–MEG spreads and crude oil fluctuations directly influence margins and competitiveness. Chart 1 illustrates these relationships, showing how energy volatility drives PSF price trajectories.
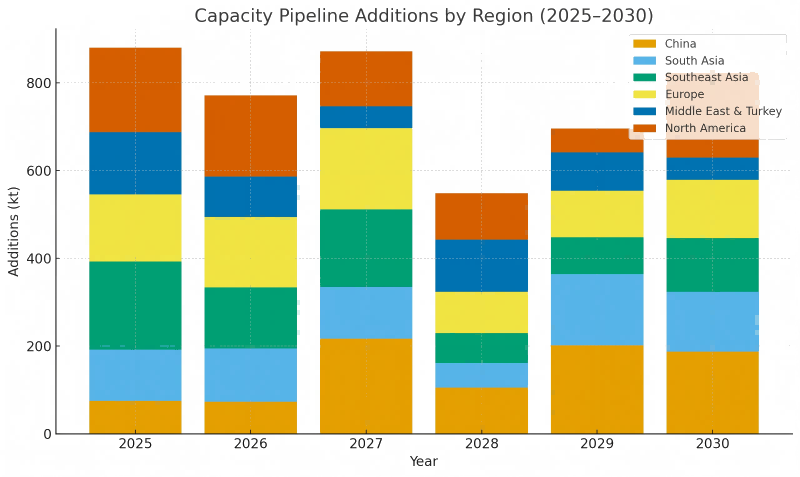
Supply Landscape & Capacity Pipeline
The global capacity pipeline remains concentrated in Asia, with China, South Asia, and Southeast Asia adding over two-thirds of new capacity. Integration with upstream PTA and recycling feedstock ensures efficiency.
Virgin vs Recycled PSF Transition
Recycled PSF continues its steady ascent due to policy and brand commitments. The main constraints are feedstock collection, rPET flake quality, and mechanical yield losses.
Certification Requirements Snapshot
| Region/Retailer Cluster | Common Certifications | Traceability Expectation | Recycled Content Target |
| EU Retailers | GRS, OEKO-TEX, Bluesign | Batch-level, recycled content claims | 20–50% depending on SKU |
| US Retailers | GRS, OEKO-TEX | Supplier-level with random audits | 15–30% phased targets |
| China Brands | GRS (select), local audits | Transactional documentation | Case-by-case |
| Global Sportswear | GRS, Higg, OEKO-TEX | Digital chain-of-custody pilots | 25–60% depending on product |
| Home Textiles (EU) | GRS, OEKO-TEX, REACH | Batch/lot traceability | 30–50% fillings |
End-Use Segment Deep Dives
Apparel & Home Textiles
Sustainability-driven color programs spur dope-dyed PSF, reducing dyehouse water and energy consumption. Retailers elevate rPSF usage in basics, blends, and fillings.
Nonwovens & Hygiene
Healthcare, wipes, and diaper markets prioritize ultra-fine denier PSF and bicomponent fibers for softness and absorbency.
Automotive & Industrial
EV interiors and acoustic insulation rely on hollow conjugate siliconized (HCS) PSF; industrial filtration favors fine-denier PSF with functional coatings.
End-Use Segment Matrix
| End-Use Segment | Top Growth Drivers (2025–2030) | PSF Grade Preferences |
| Apparel & Home Textiles | Retail sustainability goals, blend optimization, dope-dyed adoption | 1.2–1.5 D solid, dope-dyed, rPSF blends |
| Nonwovens & Hygiene | Hygiene penetration, comfort upgrades, and healthcare demand | Ultra-fine denier, bicomponent, siliconized |
| Automotive Interiors | EV lightweighting, acoustic insulation, safety standards | Hollow conjugate siliconized (HCS), low-VOC |
| Building / Construction | Urbanization, energy efficiency retrofits | Hollow, coarse denier, fire-retardant |
| Filtration & Industrial | Air/water standards, industrial process upgrades | Fine denier, high-crimp, functional finishes |
Regional Outlooks
- China & East Asia: Scale leader, integrated capacity, strong rPSF base.
- South Asia: Apparel-export growth; investment in flexible fiber lines.
- Southeast Asia: Nonwovens growth, trade advantages into the US/EU.
- Europe: Tight mandates, high energy costs, regional recycling incentives.
- North America: Imports dominate; domestic rPSF projects emerging.
- Middle East & Turkey: Feedstock cost advantage; proximity to EU markets.
- LATAM & Africa: Early rPSF ecosystems; infrastructure development required.
Technology & Product Trends
- Dope-dyed PSF reduces dyehouse emissions/water usage.
- Hollow conjugate siliconized (HCS) enables premium fills.
- Chemical recycling (BHET/DMT) starts closing quality gaps between rPSF and virgin PSF.
Sustainability & Compliance
Global certification adoption intensifies. Buyers require GRS, OEKO-TEX, Bluesign, and digital traceability. Microfiber shedding mitigation becomes a must-have feature.
(Refer again to Table 2 above for regional certification differences.)
Trade Flows & Policy Watch
Anti-dumping actions and recycled-content laws reshape supply routes. EPR and DRS policies expand bottle-to-fiber collection. Asian recyclers invest in capacity closer to consumption markets.
Competitive Landscape
Top PSF producers are vertically integrated; recyclers move upstream into flake and pellet production. Converters and spinners gain leverage through quality, consistency, and verified sustainability credentials.
Pricing & Margin Outlook
PSF pricing mirrors crude and PTA trends. Under stable feedstocks, fiber margins hover near historical averages; energy spikes or rPET scarcity can squeeze profitability.
Risks & Sensitivities
- Feedstock and energy volatility.
- rPET quality/availability gaps.
- Potential mandate delays or trade restrictions.
- Slow scaling of chemical recycling.
Forecast Scenarios (2030 Snapshots)
Scenario Outcomes for 2030 (Illustrative)
| KPI (2030) | Base Case | Upside Case | Downside Case |
| Global Demand (kt) | 24 000 | 25 700 | 22 300 |
| rPSF Share (%) | 50 | 56 | 44 |
| Avg PSF Price Index (2024 = 100) | 118 | 122 | 110 |
| Global Utilization (%) | 86 | 89 | 80 |
| Avg Producer Margin ($/t) | 120 | 150 | 80 |
Strategic Implications & Recommendations
For Producers
- Enhance line flexibility between virgin and rPSF.
- Secure long-term rPET feedstock through direct partnerships.
- Expand dope-dyed and solution-colored PSF for sustainable color programs.
For Brands/Retailers
- Establish SKU-level recycled content targets and collaborate with fiber suppliers.
- Build multi-region sourcing for risk hedging.
- Adopt digital chain-of-custody tools to substantiate claims.
For Recyclers/Converters
- Upgrade washing and extrusion to fiber-grade quality.
- Offer technical support to help customers transition to rPSF.
For Policymakers
- Standardize recycled content rules.
- Expand deposit return systems (DRS) and recycling incentives.
Caselets: Brand rPSF Sourcing Programs
1. Global Sportswear – Colorfast Basics
A top sportswear brand introduced dope-dyed rPSF for black/grey basics, lifting recycled content to 40–60% while cutting dyehouse water use > 20%.
2. Home Textiles – Bedding Fills
A European retailer shifted pillow/duvet fills to siliconized rPSF HCS, maintaining loft and odor control with GRS-verified sourcing.
3. Outdoor Apparel – Insulation
An outdoor brand adopted 100% rPSF insulation, linking bottle-collection batches to garment lots via digital traceability.
4. Hygiene Converter – Softness Blend
A converter blended ultra-fine rPSF with PP to improve softness in topsheets, maintaining cost while locking annual recycled-feedstock contracts.
Global PSF markets through 2030 will hinge on sustainable transformation. rPSF will anchor future growth, supported by policy, consumer awareness, and brand commitments. Producers investing now in flexible capacity, digital traceability, and feedstock partnerships will define the next era of textile and nonwoven competitiveness.